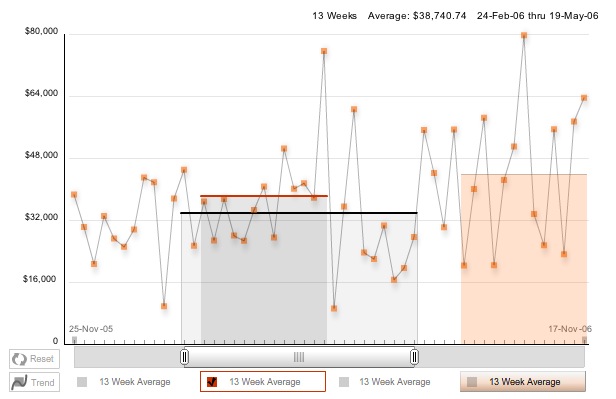
Cogistics 52 Week Rolling Graph
This is a Actionscript element that works within a client’s site. It pulls data from a database and feeds this Actionscript graph which then rebuilds and updates itself dynamically. The live version does a database query and then feeds the data back via XML, read through the Actionscript and then builds out the graph according to each customers history.
This image links to a dummy version of this graph hosted on my own server. The data is fixed and pulls from a static XML sheet.
